Last week we opened Practice Worth to the public. Since then the question I keep coming back to is one most owners can’t answer off the top of their head: what is your practice actually worth today? Not the round figure a colleague mentioned at a study club. The real one.
Here is the trap that catches almost everyone. You look at the bottom line on your tax return, multiply it by some rule of thumb you heard once, and treat that as your answer. The free online calculators do the same thing in a prettier wrapper. You type in collections, they hand back a percentage, and you walk away with a figure that can be off by hundreds of thousands of dollars in either direction. The multiple is rarely the problem; the number you apply it to usually is.
A buyer doesn’t pay for the profit your accountant reports. They pay for the profit the practice will produce for them. Those are two different numbers, and the distance between them is where most of your value is hiding. Closing that gap is called normalizing earnings, and it is the entire game.
Start with your own pay
If you are a producing owner, your compensation on the books mixes two things a buyer separates: the wage you earn for the dentistry you personally do, and the profit you keep as the owner. A buyer backs out the clinical wage at market rate and counts the rest as earnings. Get that single adjustment wrong and the valuation swings by six figures.
Then come the add-backs
Depreciation and amortization are real on a tax return and meaningless to a buyer pricing future cash flow, so they go back in. The practice vehicle, the continuing-education travel, the family member on payroll who doesn’t work in the office, the one-time legal bill from three years ago. Each of these gets examined and, where it is defensible, added back to earnings. I have watched a practice’s adjusted profit climb by more than half a million dollars once every legitimate add-back was on the table. That half million, times the multiple, is the part the napkin math and the free calculator never see.
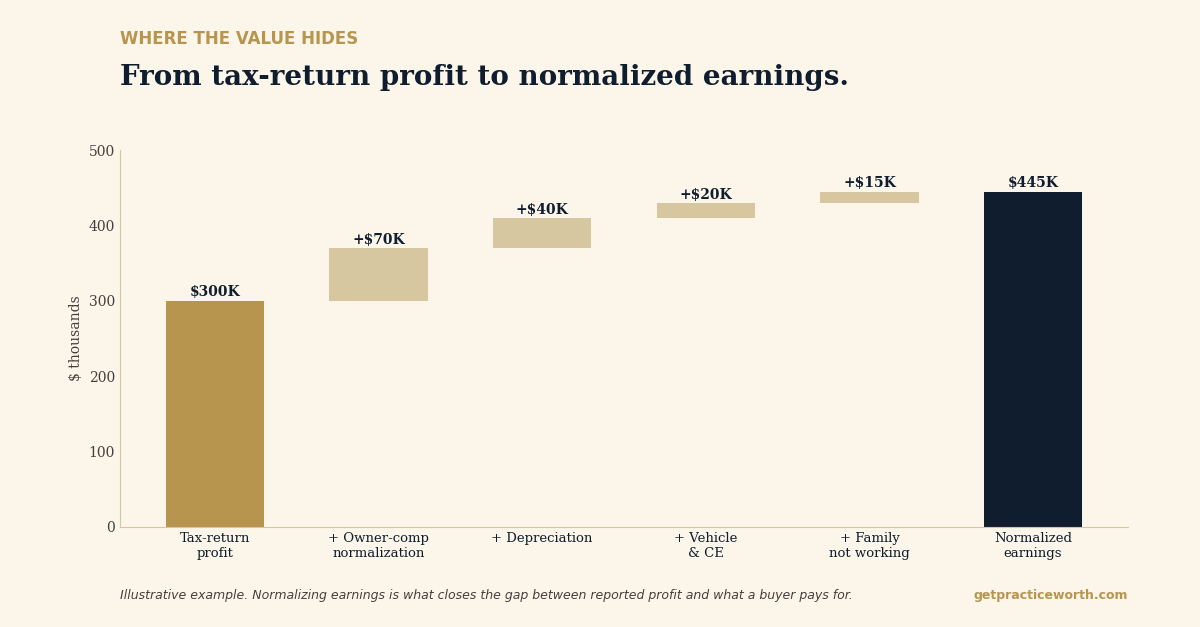
Here is the shape of it with round numbers. Say your tax return shows $300,000 in profit. You pay yourself $250,000 in clinical wages, but the market rate for the dentistry you personally produce is $180,000, so $70,000 of owner profit comes back into earnings. Add $40,000 in depreciation, $20,000 for a practice vehicle and CE travel, and $15,000 for a family member who isn’t working in the office.
Normalized earnings land near $445,000 instead of $300,000. Apply any reasonable multiple to the second figure and you are looking at a materially different practice, and the more accurate one.
Why I built the tool this way
This is why I built Practice Worth the way I did. It walks you through the same normalization a buyer’s analyst would run, line by line, and asks the questions a calculator never asks. It doesn’t guess at your owner comp. It has you set it. It doesn’t ignore your add-backs. It surfaces them and lets you decide which ones hold up.
Once the earnings are right, a handful of factors move the final number more than anything else:
- Your specialty mix, and how much of production depends on you personally.
- Your hygiene program and the recurring revenue it represents.
- Your team’s stability, and whether an associate is already in place.
- Your location and the patient demand around it.
In the tool these aren’t theory. They are levers you can move to see what each one is worth, so you understand not just your value today but what raises it.
If you bought a report during launch week and haven’t opened the wizard yet, this is the week to do it. Block twenty minutes, keep last year’s profit-and-loss statement next to you, and run your own practice. Most owners finish surprised, and usually the surprise is to the upside.
You can’t plan an exit or a partnership around a number you guessed. Start with the real one.
About the author. Dr. David Eslinger holds a DDS and an MBA and has spent more than a decade on the buy side of dental practice transactions, founding Eslinger Dental Consultants and holding C-suite, executive leadership, and board roles in the DSO industry. Karen Eslinger, RDH, co-founded Practice Worth in 2026. Practice Worth is a Missouri LLC. Learn more at getpracticeworth.com.
Karen’s companion piece looks at the value a buyer pays for beyond the earnings: the part your P&L never shows.